SDG 11 – “Make cities and human settlements inclusive, safe, resilient and sustainable” – is made up of 10 targets and 15 indicators. It covers aspects of safe and accessible urban spaces and services such as housing (SDG 11.1), transport (SDG 11.2) and green spaces (SDG 11.7). It aims to protect cultural and natural heritage (SDG 11.4) and focuses on urban aspects of environmental protection (SDG 11.6) and the impacts of natural disasters (SDG 11.5). Inclusive and sustainable planning (SDG 11.3) is a priority for this SDG, along with specific planning-related targets for integrated urban and regional planning (SDG 11.A) and integrated local disaster risk-reduction strategies (SDG 11.B). Finally, there is one target on financial and technical assistance for resilient building (SDG 11.C).1
This goal pays special attention to vulnerable communities, including slum dwellers (11.1), women, children, persons with disabilities (11.2 and 11.7) and the poor (11.5). There are also gendered aspects to the SDG 11 indicators. For instance, transportation systems (11.2) are often built to meet the needs of men without considering the needs of women.2
SDG 11 will be reviewed at the 2018 High Level Political Forum, along with SDGs 6 (Clean Water), 7 (Sustainable Energy), 12 (Sustainable Consumption and Production), and 15 (Life on Land). SDG 17 (Partnerships for the goals) is reviewed annually.3
Context
SDG 11 is the first standalone global development goal on urban development. The earlier Millennium Development Goals (MDGs) included a target to “achieve… significant improvement in the lives of at least 100 million slum dwellers”, but this target did not show the full picture of urban development.4 For instance, during the period of the MDGs, the target was achieved, but the overall number of people living in slums also increased.5
Urbanization has been happening faster than expected. In 2007, a new milestone was reached – for the first time, more people lived in urban than rural areas.6 For the Lower Mekong countries (LMCs) and China, the rate of urbanization is higher than the world average.7 This rapid growth is concerning, especially for countries that are also considered some of the least urbanized in the world.8 Issues include growing numbers of slum dwellers, increased air pollution, inadequate basic services and infrastructure and unplanned urban sprawl. All of these are exacerbated by climate change and increased vulnerability to disaster.9 Work on SDG 13 (Climate Action) will thus have a significant impact on this SDG.
Recently, countries around the world, including the LMCs, participated in developing a new initiative around urban development called the New Urban Agenda. Adopted in 2016, it intends to embrace urbanization to promote better urban planning and integrate equity into the development agenda, while supporting the implementation of SDG 11.10
SDGs 1 (No Poverty) and 13 (Climate Action) include similar targets as SDG 11 and use some of the same indicators.11 There are many other connections with other SDGs – about a third of the SDGs have an urban component.12 The visualisation below shows a few of the interlinkages for this goal.
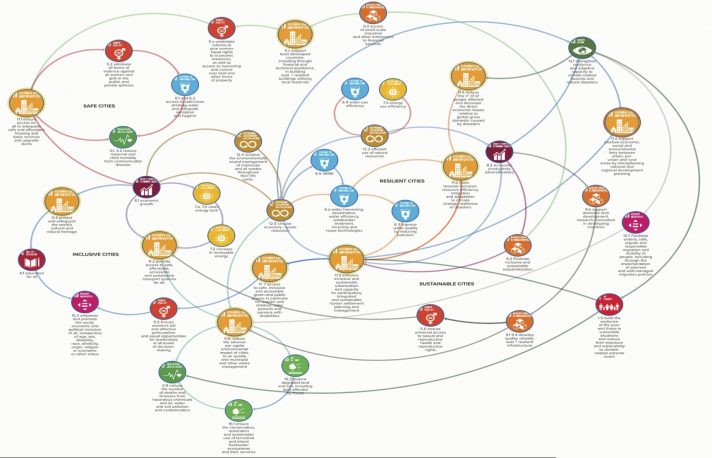
SDG 11 is interlinked with many of the other SDGs. This map is not comprehensive and shows only some of the interlinkages. Source: UNESCAP. Accessed June 19, 2018.
Localisation and regionalisation
In the Asia-Pacific region, the cities in less-urbanized and least-developed countries are undergoing the most rapid urban growth. They will need extra capacity and financial support to ensure that such growth happens sustainably.13 This includes the LMCs, particularly Cambodia, Laos, Myanmar and Vietnam.
Thailand, Lao PDR, Vietnam, and Myanmar form a group of semi-urban countries, while Cambodia remains almost 80 percent rural.14 Urban growth is predicted to increase dramatically. Urban populations in Cambodia and Laos in 2050 are predicted to be three times that of 2010, and double in Myanmar and Vietnam.15 Ho Chi Minh City and Bangkok are expected to become mega cities (over 10 million people) by 203016 and small and medium-sized towns are also expected to see significant growth.17 This growth comes primarily from urban-to-rural migration for financial opportunities.18 Natural disasters also drive migration to urban areas, and these numbers are expected to increase due to impacts of climate change.19 Note that urbanization projections are known to be systematically underestimated, perhaps masking the real potential of urbanization issues.20
With rapid urban growth has come an increase in informal slum settlements. In 2014, the highest proportion of the urban population living in informal slum settlements in the LMCs was in Cambodia at 55 percent, while the lowest at 25 percent was in Thailand.21 While slum settlements can be areas of social mobility and innovation, they more frequently entrench poverty.22 They also lack sufficient infrastructure and service delivery.23 The issue of providing suitable housing options and services to the many people who migrate to cities requires integrated national and urban policies and a large investment in infrastructure to see improvements for all urban dwellers.24 Thailand is seen as a success story for reducing slum dwelling through strong political commitment, strategic planning and monitoring.25 Thailand’s experience could be useful for countries like Cambodia and Lao PDR.26
Urban growth is closely tied with sustainability. Unplanned urban growth moves city infrastructure beyond what it can handle, even without further growth. It also impacts the sustainability of natural resources. Natural resource use and waste and emissions are increasing rapidly in countries like Cambodia and Vietnam, where a growing middle class is buying more electronics, buying cars and producing more waste. This growth, in part, supports urbanization. Sustainable natural resource management, including the infrastructure necessary for public transportation and waste management, needs to be considered as part of urban planning to help establish more stability in accessing necessary resources.27
Given the connection between infrastructure and developing inclusive cities, it makes sense that ASEAN envisions strong overlaps between this SDG and ASEAN 2025’s focus on developing connectivity and infrastructure. This includes enabling universal access to essential services such as water, sanitation and electricity. The development of this infrastructure needs to be sustainable, which in ASEAN is closely linked to development and urban planning. Additionally, ASEAN’s view on sustainable infrastructure is strongly connected to the environmental performance of a national economy. ASEAN 2025 focuses on improved urban planning to make cities both more climate resilient as well as responsive to the needs of low-income groups. Since infrastructure investments have a long lifetime, green and sustainable solutions should be favored.28 An integrated approach, making use of technology, could tackle many of these issues, including connectivity (11.2), planning (11.3 and 11.A), cultural preservation (11.4) and preserving community and public goods (11.7).29
UNDP-supplied water storage tanks in Chin State, Myanmar, help provide clean water for sanitation. Photo by John Cheatham, via Flickr. Licensed under CC BY 2.0.
Similarly, UNESCAP’s road map focuses primarily on infrastructure development rather than sustainable urban development as a whole.30 Ultimately, work on transport connectivity has supported progress on SDG 11.31
Regional cooperation is increasing, with cities sharing good practices and jointly influencing global agendas through initiatives and networks, including ones relevant to the LMCs such as the 100 Resilient Cities, the C40 Cities Climate Leadership Group, UCLG, and the ASEAN Cities Mayors Forum.32
Means of implementation
While SDG 11, like the other SDGs, has specific means of implementation goals, the underlying focus for this goal is on the systemic means of implementation. Target 11.3 refers to more inclusive and participatory policymaking, while the focus on accessibility, safety and environment in 11.1, 11.2, 11.6, and 11.7 imply greater public participation in governance. UNESCAP, the Asia-Pacific regional coordinating body which is tasked in part with assisting the region with providing policy guidance, has identified five priority actions in the region, all of which are focused on means of implementation, whether systemic or financial. They are:
- Governance (11.6, 11.7)
- Financing (11.c)
- Urban resilience and circular economy (11.b, SDG 12 SCP)
- Inclusivity (11.3, 11.7, 11.a)
- Integrated urban planning (11.a).
Although ASEAN 2025 touches on issues such as infrastructure and connectivity that have a strong impact on the means of implementation for SDG 11, planning at the national and city levels remains necessary. In this regard, UNESCAP has indicated that localisation is especially important for this SDG.33 UN-Habitat, the custodian agency for the eight of the 15 indicators of SDG 11 has developed a set of guidelines to assist national and local governments with monitoring and reporting on the SDG 11 indicators. There is a huge financing gap for this goal.34
Follow up and review, monitoring and evaluation
Global data are available for less than helf of the indicators under Goal 11 (11.1.1, 11.5.2, 11.6.2 and 11.B.1). Methodological work is completed for five of the SDG 11 indicators (11.2.1, 11.3.1, 11.5.1, 11.6.1, 11.B.2). The remainder require methodological work before data can be collected (11.3.2, 11.4.1, 11.7.1, 11.7.2, 11.A.1, 11.C.1).
| Indicator | Tier | Custodian Agency | Notes |
|---|---|---|---|
| 11.1.1 | I | UN-Habitat | -- |
| 11.2.1 | II | UN-Habitat | -- |
| 11.3.1 | II | UN-Habitat | -- |
| 11.3.2 | III | UN-Habitat | Additional work is being done on defining methodology, as well as additional pilot studies.35 |
| 11.4.1 | III | UNESCO-UIS | Methodological work was scheduled to be completed by December 201736 |
| 11.5.1 | II | UNISDR | Same as 1.5.1 and 13.1.1.37 |
| 11.5.2 | I | UNISDR | -- |
| 11.6.1 | II | UN-Habitat, UNSD | -- |
| 11.6.2 | I | WHO | -- |
| 11.7.1 | III | UN-Habitat | Additional work is being done on defining methodology, as well as additional pilot studies.38 |
| 11.7.2 | III | UNODC | Methodological work on this indicator is expected to be completed by the end of 2018.39 |
| 11.A.1 | III | UN-Habitat | Additional work is being done on defining methodology, as well as additional pilot studies.40 |
| 11.B.1 | I | UNISDR | -- |
| 11.B.2 | II | UNISDR | -- |
| 11.C.1 | III | UN-Habitat | Work on this indicator was scheduled to be completed by November 2017.41 |
Chart created by ODM July, 2018. CC BY SA 4.0. Data source Inter-Agency and Expert Group on SDG Indicators. 2018. Tier Classification for Global SDG Indicators 11 May 2018. Accessed July, 2018.
Data availability for the LMCs is meagre. Data on 11.1.1 are estimated and modelled, and currently only available to 2014.35 Data on all three dimensions of 11.5.1 (same as 1.5.1) are available for Vietnam, but are completely missing for Thailand.36 There are no data on one dimension, missing persons due to disaster, in Cambodia, Lao PDR and Myanmar.37 LMC data on 11.6.2 are all estimates and only for 2012.38 Finally, by 2015 only Thailand and Vietnam reported that they had legislative or regulatory provisions on managing disaster risk (Indicator 11.B.1, same as 1.5.3).39
A number of issues have been identified for the SDG 11 indicators. The lack of data, disaggregated or otherwise, means that governments in the Asia-Pacific region are less able to accurately assess the status of SDG 11 in the region. In addition, certain concepts, such as “slum” and “homelessness”, do not have a widely-agreed definition. Member states in the Asia-Pacific region have also noted that the current SDG 11 should be broadened to take into account social and cultural dimensions. For example, the metric for protecting people from disaster-related shocks (11.5) should not just capture loss of lives but also losses of livelihoods and assets. Similarly, the definition of cultural and heritage sites (11.4) should be broadened to include not just monuments but also intangible cultural heritage and culture practices such as dance, music, and clothing.40
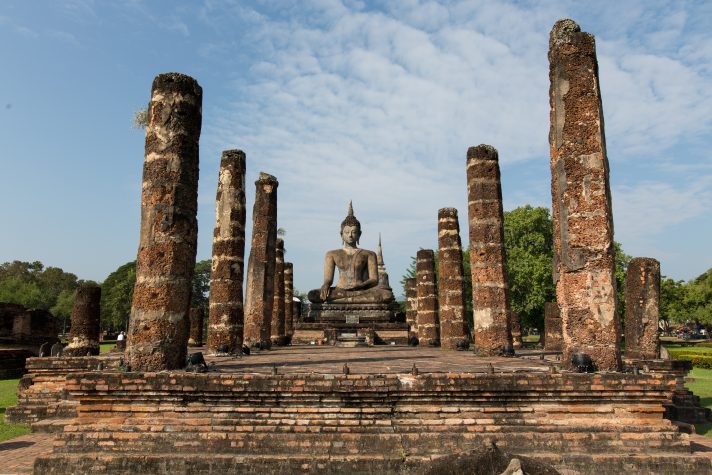
Cultural heritage includes tangible sites like Thailand’s Sukhothai, which is considered the beginnings of Thai architecture. However, a broad definition of cultural heritage can also include food, dance, music, and clothing. Photo by PA, via Wikimedia. Licensed under CC BY-SA 4.0.
Finally, city-level data have typically been missing or inadequately collected.41 To address this issue, UN-Habitat has developed a global initiative called the “City Prosperity Initiative”, which is made up of an index of six dimensions that allows city authorities to identify opportunities and areas for improvement, as well as a platform for dialogue.42 UN-Habitat has proposed that this initiative be adopted by local and national governments as a monitoring platform for SDG 11, and any other SDG indicator that has an urban component.43 According to data collected in 2016, Bangkok (Thailand), Ha Noi (Viet Nam), and Ho Chi Minh City (Viet Nam) have elected to participate in this initiative.
References
- 1. UNSD. Sustainable Development Goal 11. Accessed June 6, 2018.
- 2. UN Chronicle. 2015. SDG 11 – Cities will play an important role in achieving the SDGs. Accessed June 8, 2018.
- 3. UN DESA. High-Level Political Forum 2018. Accessed June 7, 2018.
- 4. UN. Goal 7: Ensure Environmental Sustainability. Accessed June 7, 2018.
- 5. UN Department of Public Information. 2013. Goal 7: Ensure Environmental Sustainability Fact Sheet. http://www.un.org/millenniumgoals/pdf/Goal_7_fs.pdf. Accessed June 7, 2018.
- 6. UN DESA. 2014. World Urbanization Prospects, the 2014 Revision. Accessed February 28, 2018.
- 7. Asian Development Bank. 2016. Urban Development in the Greater Mekong Subregion. Accessed February 21, 2018.
- 8. Ibid.
- 9. UNSD. Goal 11: Make cities and human settlements inclusive, safe, resilient and sustainable. Accessed June 7, 2018.
- 10. The United Nations Conference on Housing and Sustainable Urban Development. The New Urban Agenda. Accessed June 11, 2018.
- 11. UNESCAP, ADB, UNDP. 2018. Transformation towards sustainable and resilient societies in Asia and the Pacific. Accessed June 8, 2018.
- 12. UN-Habitat. UN-Habitat for the Sustainable Development Goals. Accessed June 11, 2018.
- 13. UNESCAP. 2018. SDG 11 Goal Profile. http://www.unescap.org/sites/default/files/SDG%2011%20Goal%20Profile.pdf. Accessed June 8, 2018.
- 14. UN DESA. 2014. Country Profiles. Accessed February 21, 2018.
- 15. United Nations Habitat and Economic and Social Commission for Asia and the Pacific. 2015. The State of Asian and Pacific Cities 2015: Urban Transformations Shifting from quantity to quality. http://www.unescap.org/sites/default/files/The%20State%20of%20Asian%20and%20Pacific%20Cities%202015.pdf. Accessed February 21, 2018.
- 16. UN DESA. 2016. The World’s Cities in 2016 – Data Booklet. Accessed February 21, 2018.
- 17. Asian Development Bank. 2016. Urban Development in the Greater Mekong Subregion. Accessed February 21, 2018.
- 18. UNESCAP. 2013. Urbanization Trends in Asia and the Pacific. http://www.unescapsdd.org/files/documents/SPPS-Factsheet-urbanization-v5.pdf. Accessed February 28, 2018.
- 19. Ibid.
- 20. Graeme Hugo. 2014. World Migration Report 2015: Urban Migration Trends, Challenges, Responses, and Policy in the Asia Pacific. https://www.iom.int/sites/default/files/WMR-2015-Background-Paper-GHugo.pdf. Accessed February 21, 2018.
- 21. UNESCAP. 2018. UNESCAP Data – Slum Population. Accessed June 18, 2018.
- 22. UNESCAP, ASEAN. 2017. Complementarities between the ASEAN Community Vision 2025 and the United Nations 2030 Agenda for Sustainable Development: A Framework for Action. Accessed June 8, 2018.
- 23. Ibid.
- 24. Ibid.
- 25. UNESCAP. 2017. Southeast Asia Subregion Challenges and Priorities for SDG Implementation. Accessed June 8, 2018.
- 26. Ibid.
- 27. UNESCAP, ASEAN. 2017. Complementarities between the ASEAN Community Vision 2025 and the United Nations 2030 Agenda for Sustainable Development: A Framework for Action. Accessed June 8, 2018.
- 28. Ibid.
- 29. Ibid.
- 30. UNESCAP. 2017. Regional Road Map for Implementing the 2030 Agenda for Sustainable Development in Asia and the Pacific. Accessed June 8, 2018.
- 31. APFSD. 2018. Progress with regard to the regional road map for implementing the 2030 Agenda for Sustainable Development in Asia and the Pacific. Accessed June 8, 2018.
- 32. UNESCAP. 2018. SDG 11 Goal Profile. http://www.unescap.org/sites/default/files/SDG%2011%20Goal%20Profile.pdf. Accessed June 8, 2018.
- 33. Ibid.
- 34. Ibid.
- 35. SDG Indicators, Global Database. Indicator : 11.1.1 – Proportion of urban population living in slums, informal settlements or inadequate housing. Accessed June 11, 2018.
- 36. SDG Indicators, Global Database. Indicator : 11.5.1 – Number of deaths, missing persons and directly affected persons attributed to disasters per 100,000 population. Accessed June 11, 2018.
- 37. SDG Indicators, Global Database. Indicator : 11.5.1 – Number of deaths, missing persons and directly affected persons attributed to disasters per 100,000 population. Accessed June 11, 2018.
- 38. SDG Indicators, Global Database. Indicator : 11.6.2 – Annual mean levels of fine particulate matter (e.g. PM2.5 and PM10) in cities (population weighted). Accessed June 11, 2018.
- 39. SDG Indicator, Global Database. Indicator : 11.B.1 – Number of countries that adopt and implement national disaster risk reduction strategies in line with the Sendai Framework for Disaster Risk Reduction 2015-2030. Accessed June 11, 2018.
- 40. APFSD. 2018. Report of Roundtable on SDG 11 on Sustainable Cities and Communities. http://www.unescap.org/sites/default/files/APFSD%20Roundtable%20SDG%2011%20Report_1.pdf. Accessed June 8, 2018.
- 41. UN-Habitat. City Prosperity Initiative. Accessed June 11, 2018.
- 42. Ibid.
- 43. UN-Habitat. A Platform to Measure SDGs. Accessed June 11, 2018.
